| |
| Last Week in Review |
|
|
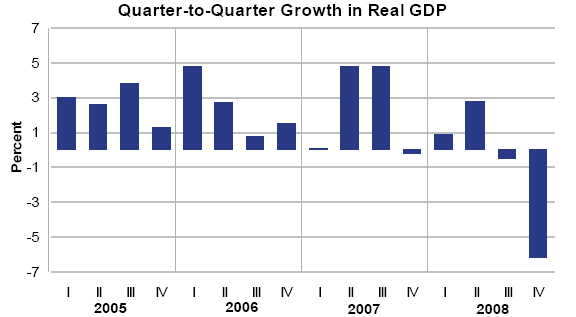
| "BAD NEWS GOES ABOUT IN CLOGS, GOOD NEWS IN STOCKINGED FEET." Welsh Proverb. And while last week did have some negative economic reports clomping through the headlines, there was also some good news tiptoeing around. The unemployment line is getting even longer, as Initial Jobless Claims showed that the number of people collecting benefits reached a record high of 5.11 million. Not surprisingly, Consumer Confidence fell to its lowest reading since records began in 1967. The sour report indicates that the fear of losing one's job has made the consumer more reluctant to spend. Gross Domestic Product (GDP) is the broadest measure of economic activity - and for the 4th quarter of 08, came in worse than expectations and at its lowest reading since 1982. You can see the comparison for the last four years in the chart below.
The news on the housing front was also gloomy; as New Home Purchases dropped to the lowest level since data collection began in 1963. Existing Home Sales for January came in lower than expected; however, that number was probably influenced by buyers waiting to see what the government's Stimulus Plan might have in store for them. The Treasury Department announced on Friday that they plan to take a 36% stake in Citigroup by converting $25 Billion of preferred shares into common stock. The move will dramatically dilute shareholder value, but should help bolster the struggling bank's capital base. Some good news from Reuters, as they released the results of a survey of 47 professional forecasters, predicting that the economy will begin to recover in the second half of this year. Additionally, the Chicago Purchasing Managers Index was better than expected, and being a forward-looking indicator, gives another bright spot of hope down the road. Despite the negative news, Bonds and home loan rates were not able to make improvements over the course of the week, and ended a bit worse than where they began. MORE CLARIFICATION ON THE ECONOMIC STIMULUS PLAN...AND HOW IT MAY BENEFIT YOU! READ THE WEEK'S MORTGAGE MARKET VIEW BELOW FOR MORE DETAILS. |
| Forecast for the Week |
|
|
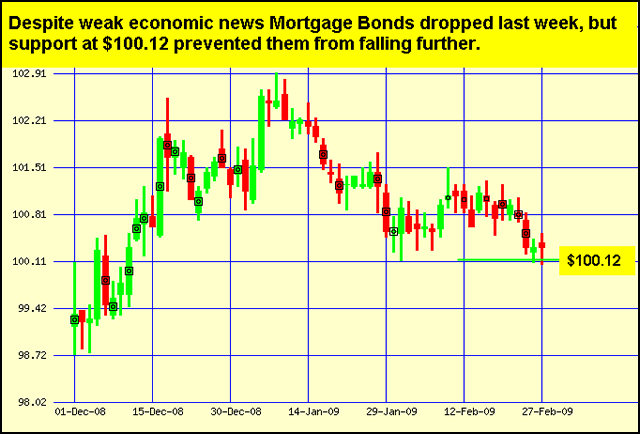
| The week ahead will be bookended with two very important economic reports, and could be volatile in between with more details on the Homeowner Affordability and Stability Plan due to be released on Wednesday. Among the details to be released is information on whether loans that are in good standing, and which are already guaranteed by Fannie Mae and Freddie Mac, will be able to refi, even if the loan balance is 5% greater than the home's current value. This will determine the ability of many homeowners to benefit from lower rates. Currently many homeowners would love to cut their monthly expenses with the lower home loan rates available today, but are unable to due to the drop in home values. This new provision could help many people solve that dilemma. I will be watching this closely and would enjoy speaking with you more about this as details are released to see if this can benefit you. Monday brings the details on the Fed's favorite gauge of inflation, the Core Personal Consumption Expenditure (PCE) index, found within the Personal Income report. Given the recent concerns on deflation, it will be interesting to see what this report shows. On Friday, the Labor Department releases its Jobs Report for February. Last month's report showed that 598,000 jobs were lost in January, and that about 3.6 Million jobs have been lost since December 2007. Given the number of new Initial Jobless Claims filed last month, Friday's Jobs number probably won't be a pretty one. Weak economic news normally helps Bonds and home loan rates improve, as money flows out of Stocks and into Bonds. However, Bonds and home loan rates worsened last week, despite the weak economic news, due to tough technical resistance and the enormous supply of Bonds being put out on the market. But as you can see in the chart below, an important floor of support kept Bonds and home loan rates from worsening further. I will be watching closely to see if Bonds and home loan rates can reverse course and find some improvement in the coming days. Chart: Fannie Mae 4.5% Mortgage Bond (Friday Feb 27, 2009)
|
| The Mortgage Market View... |
|
|
Higher, Non-Jumbo Loan Amounts Extended For those who are considering taking advantage of the $8,000 tax incentive for first-time homebuyers which is included in the president's economic stimulus bill, there is some more good news that could make doing so easier and more accessible. An extension is now officially in place on the higher loan limits for mortgages in the tier that lies just below what is considered a "jumbo" loan. First established last year, and now extended through the end of 2009, limits on this additional tier provide opportunities for many who are looking to either refi or, better yet, take the plunge into first time home ownership and grab a piece of the highly publicized $8,000 tax incentive. Here are some key points about this higher loan limit extension, announced by the Fair Housing Finance Agency this past week:
I can provide you with information about qualifying for the opportunities that are provided by the stimulus plan. Speaking of qualifying, if you are not sure if you if you can take advantage of the $8,000 tax incentive, here are some examples to help you better understand the income limits and phase-out structure. The $8,000 incentive starts phasing out for couples with incomes above $150,000 and single filers with incomes above $75,000 and is phased out completely at incomes of $170,000 for couples and $95,000 for single filers. To break down what this phase-out means, the National Association of Homebuilders (NAHB) offers the following examples: Example 1: Assume that a married couple has a modified adjusted gross income of $160,000. The applicable phase-out threshold is $150,000, and the couple is $10,000 over this amount. Dividing $10,000 by $20,000 yields 0.5. When you subtract 0.5 from 1.0, the result is 0.5. To determine the amount of the partial first-time homebuyer incentive to this couple, multiply $8,000 by 0.5. The result is $4,000. Example 2: Assume that an individual home buyer has a modified adjusted gross income of $88,000. The buyer's income exceeds $75,000 by $13,000. Dividing $13,000 by $20,000 yields 0.65. When you subtract 0.65 from 1.0, the result is 0.35. Multiplying $8,000 by 0.35 shows that the buyer is eligible to reduce the tax liability by $2,800. Remember, these are general examples. Borrows should consult a tax advisor to provide guidance relevant to their specific circumstances. |
| The Week's Economic Indicator Calendar |
| Remember, as a general rule, weaker than expected economic data is good for rates, while positive data causes rates to rise. Economic Calendar for the Week of March 02 – March 06
|
| Meghan Knoy
|


Comments